
We are in uncertain times politically, geopolitically and economically. It is this uncertainty that drives our high degree of confidence in the outlook for our three investment platforms – Credit, GP Strategic Capital and Real Estate.
Looking into 2024 at a U.S. macro-level, the Federal Reserve’s sustained campaign against inflation is showing preliminary signs of success. Subsequent indicators, however, may prove otherwise, and it will be interesting to see how the overall economy fares going into the first quarter of the year. Regardless, the recent rally in stocks and bonds suggests investors are very optimistic about the potential for interest rate cuts after an unprecedented period of tightening monetary policy. Given how stubborn inflation is and how strong the performance of the economy appears to be through the lens of our portfolio companies, we are not so sure about this very broadly accepted view.
If the cost of capital eases even modestly, the floodgates of M&A may begin opening as private equity firms seek to deploy a record $2.6 trillion of dry powder. The tailwinds of this deployment can benefit the overall alternatives industry, creating an especially potent advantage for firms such as Blue Owl, whose capital solutions are intended to service the needs of financial sponsors.
Less clear is the state of global affairs. The conflict in the Middle East is a human tragedy first and foremost, but thus far has had limited impact on the financial markets. This could change if the conflict continues with the potential for repercussions across the broader EMEA region. Uncertainty with China also persists, especially as it relates to capital commitments from U.S. investment firms and ongoing trade disputes. Throw in a U.S. Presidential election, and even the most self-assured markets forecaster may want to pause for a moment of self-reflection.
Within this potentially dichotomous paradigm, Blue Owl will continue to focus on driving value for our investors and our users of capital.
As has always been the case for Blue Owl, the focus of our products and solutions is on income generation and capital preservation, two areas investors tend to prioritize during times of uncertainty. This coming May will also mark three years as a public company, a milestone we are excited and incredibly humbled to celebrate.
With all that said, we invite you to delve deeper into the outlooks for each of our three investment platforms. We hope these can serve as a helpful roadmap for how we think about our respective business areas and provide some insights into the markets in which we operate.
We wish you all the best this year.

By Craig Packer, Co-President, Head of Credit
At this time last year, we were cautious about what lay ahead for the economy and our borrowers. Inflation was stubbornly high, public markets were volatile and a soft landing seemed aspirational. This environment bore several risks, but, in our view, it also brought some unique opportunities. Dislocation in public credit markets meant that direct lenders financed the majority of the private equity-driven deal flow.1 We also observed spreads at all-time highs for new deals with conservative leverage and strong credit quality. As existing portfolio companies continued to perform well despite higher interest burdens and direct lending fund returns across the industry followed suit, we believe the asset class received further validation of its staying power and durability.
Sitting here one year later, key indicators reflect a decidedly more positive economic backdrop. Inflation is waning, employment remains strong2 and Fed policy seems to be heading into an easing cycle. That said, we remain vigilant of potential tail risks arising from higher borrowing costs and a potential retreat in economic growth. We also expect that substantial pent-up M&A demand should yield a more active deal environment. As such, we believe scaled capital providers that can speak for size, deliver a full suite of financing solutions, and remain consistently active in direct lending across the market cycle, are best-positioned to lead high-quality deals and deliver strong risk-adjusted returns.
In this piece, we present five themes that we think will characterize the direct lending market in 2024.
1. Direct lending continues to outperform other asset classes
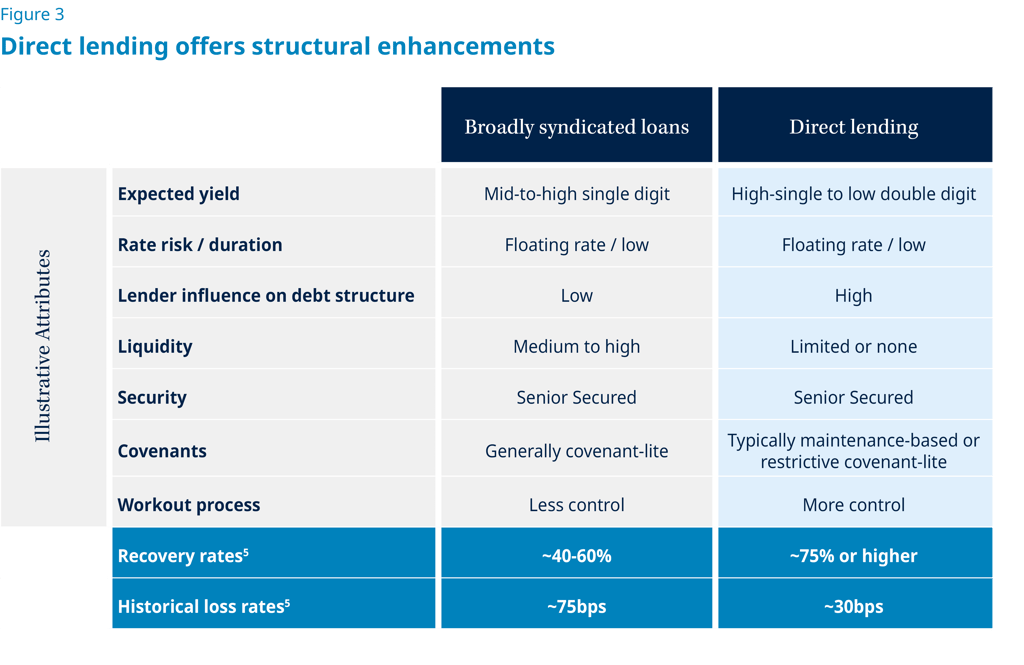
The direct lending asset class is benefitting from an elevated interest rate environment and is currently generating record returns. In contrast to fixed income, the floating rate nature of loans increases their earnings power as rates increase. In 2023, direct lending returns rose +8.9%, as compared to –2.2% and +5.9% for traditional fixed income and high yield, respectively. Even as Fed policy is expected to ease this year, rates are likely to remain comfortably above their levels before the recent hiking cycle. Further, direct lending has historically outperformed competing markets during “flat-to-falling” interest rate cycles.3
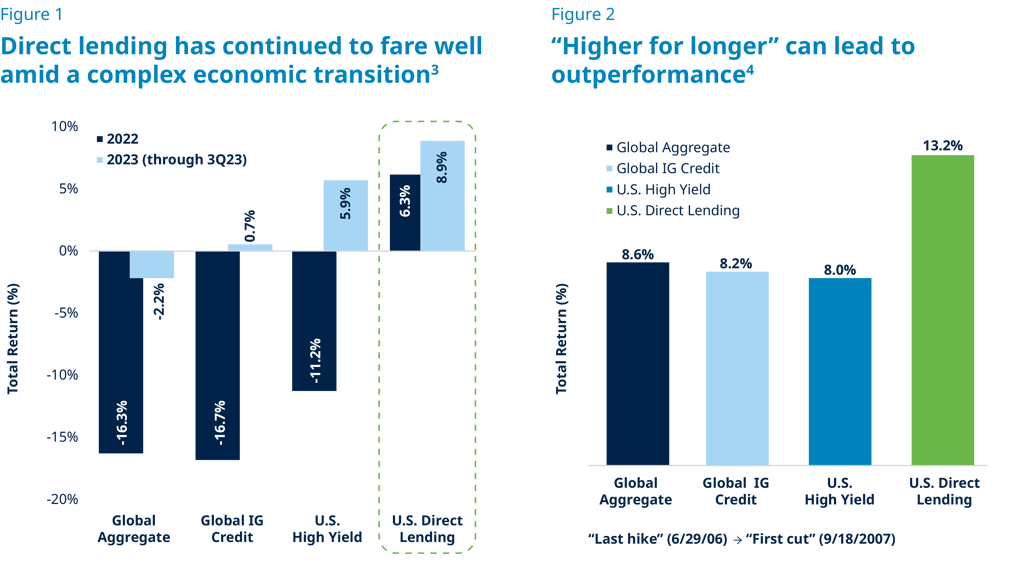
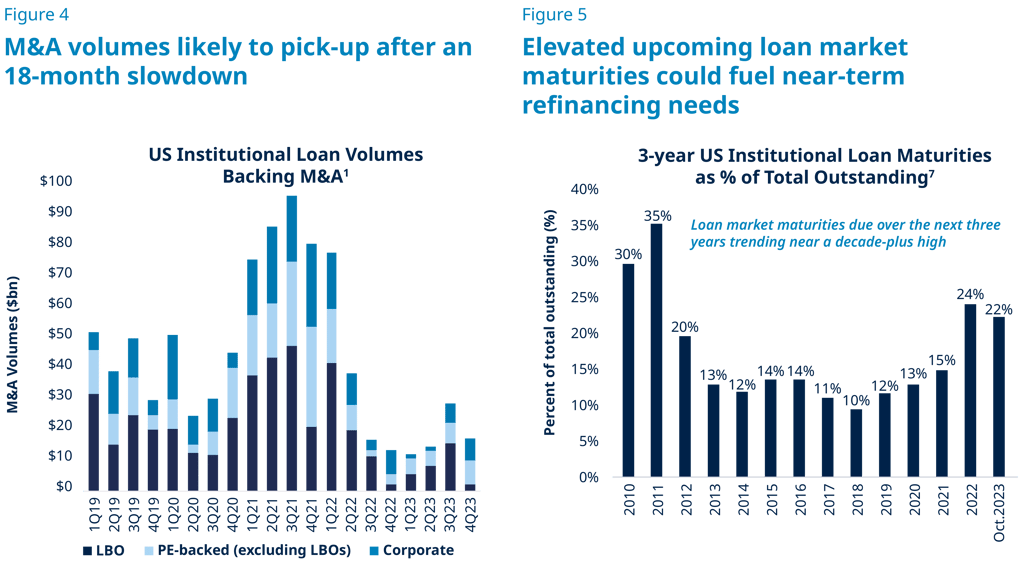
While leveraged loan returns should also benefit from the higher rate environment, we believe direct lending is poised to outperform the syndicated loan market, particularly on a risk-adjusted basis. Less cyclical sector orientation, simpler capital structures, capital preservation features, private equity-style due diligence, in-house workout capabilities and higher equity cushions all facilitate lower default and loss rates relative to the syndicated loan market.

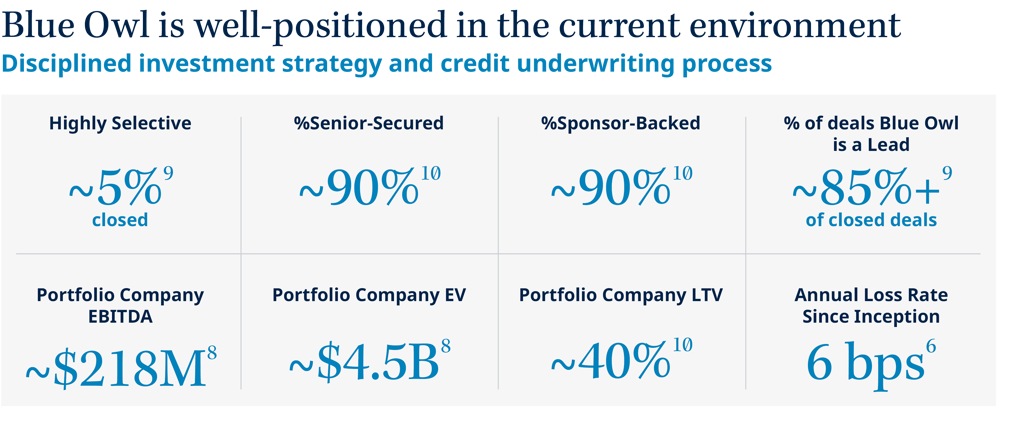
2. Pent-up demand for M&A should yield a healthy deal environment in 2024
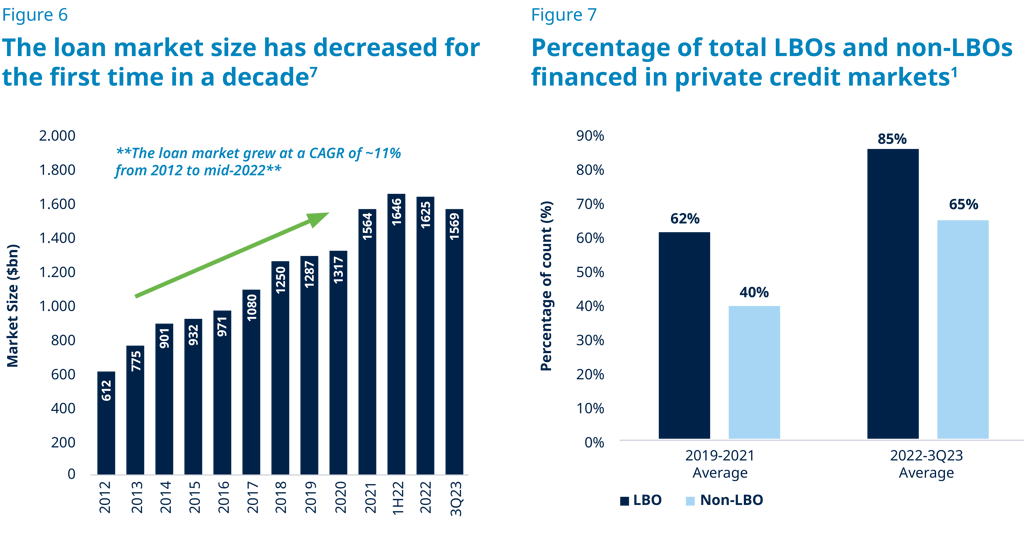
Light investment and exit activity over the last twelve months have generated substantial pent-up demand for M&A.1 This should create a more active deal environment this year as the rate outlook stabilizes and markets return to normalcy. In addition, private equity firms have ample dry powder to deploy and will be motivated to return capital to investors after a period of limited distributions. We anticipate an increase in sponsor-to-sponsor LBOs and refinancings, which were quiet in 2023 but have begun to come back. We also expect a continued steady flow of take-privates, corporate carveouts and tack-on acquisitions for existing portfolio companies.
Large platforms that have a long direct lending track record may also benefit from incumbency positions, in which they provide incremental capital to existing borrowers, as portfolio companies trade hands or make transformative acquisitions. Last year, over 40% of our new deals were made with existing partners, and we expect this percentage to grow over time.
Spreads on new deals have tightened from highs at the beginning of 2023. This has come alongside the further reopening of public credit markets and an influx of capital into direct lending.1 However, we expect absolute returns will remain compelling as benchmark rates remain high. Many new deals are also coming at lower leverage and loan-to-values than in prior years, resulting in improved risk-adjusted return profiles.
Finally, we expect repayments will increase alongside ramping deal activity. This should increase direct lending fund returns as loans are repaid at par and, in certain instances, call protection premia are collected.
3. Borrowers should continue to perform well amidst an improving macroeconomic backdrop
Borrowers have been resilient amidst an inflationary and rising rate backdrop. While this is partly driven by continued strength of the economy at large, we feel it is also supported by our focus on scaled, high-quality borrowers. Indeed, average EBITDA across our direct lending platform is over $200 million.8 We believe such businesses are better positioned than traditional middle market companies by virtue of their diversification, strategic significance in their industries, greater operating leverage, and ability to withstand unforeseen cost pressures.
Our portfolio is also skewed toward durable end markets such as software, healthcare and food & beverage. Across most sectors in which we invest, we have observed low-to-mid single digit quarterly revenue and earnings growth. Margins have improved in recent months as inflation wanes, price increases are realized and companies proactively cut costs. We expect borrowers to demonstrate continued resilience this year.
Even in a sustained elevated-rate environment, we anticipate the vast majority of borrowers will maintain more than adequate cash cushions. While a small number could experience liquidity pressures, we believe we are largely insulated by ~60% average equity cushions beneath our debt and private equity firms’ demonstrated ability and willingness to support their investments with additional capital when needed. Finally, we expect that any modest increase in losses will be more than offset by the earnings accretion of our funds from higher benchmark rates.
4. The long-term opportunity for direct lending continues to grow
We believe the direct lending asset class is still in the early innings of growth. Today, it represents only approximately 20-25% of the leveraged finance market with potential to grow to 35%+ over the next several years.11 This growth is driven by both ‘supply’ and ‘demand’ factors. Direct lending presents an attractive value proposition for end investors and users of capital, both of which should continue to support the upward momentum of the asset class.
From a ‘supply’ perspective, we believe direct lending is more commonly becoming a strategic, rather than tactical, portfolio allocation. It seeks to deliver consistent yield that is not correlated to public markets. At the same time, ‘demand’ has increased as we have observed companies becoming more comfortable choosing private financing over public markets execution. In our view, sponsors appreciate the predictability, flexibility, privacy and partnership approach of private loans. Not only can direct lenders speak for large size on deals, but they can also offer a full range of solutions across the capital stack.
Direct lending was an outsized beneficiary of market volatility in 2023. With public credit markets effectively closed, direct lenders financed 86% of leveraged buyouts last year.7 Even as public credit markets return, we believe this share shift toward direct lending will likely continue.
5. Managers differentiate with scale and strength of sponsor relationships
We believe scaled direct lenders are better positioned to succeed than sub-scale capital providers by virtue of their deep origination capabilities, strong sector-specialized underwriting expertise, in-house portfolio management, and workout and fund financing capabilities. Because they can write large checks and are strategically relevant to their counterparties, bigger managers typically receive better access to deal flow and can be highly selective on credit selection and deal terms. While there have been many new entrants to the space in recent years, several of which have traditional private equity, distressed or public markets heritage, we believe scaled pure-play providers that focus on direct lending across the market cycle and employ a partnership-based approach will likely continue to be a ‘first call’ on deals. In an asset class in which the best possible outcome is to recoup full principal and interest payments, top-tier manager returns are driven by capital preservation and low loss rates – not stretching for higher asset-level yields on riskier deals.
Conclusion
Looking ahead to 2024, we believe the new deal opportunity set should remain attractive, existing portfolio companies should perform well, and direct lending funds should continue to generate strong returns. We have heard many laud this time as the “golden age” of private credit, while others are cautious about how the asset class will fare. We hold a more nuanced perspective. While today’s market is attractive, and we expect it to remain so for the near-term, we do not believe one can, or should, perfectly time the market. A long-term allocation to direct lending should provide a compelling risk-adjusted return to investors across the cycle regardless of short-term vagaries in the market. Further, we believe the asset class has thus far proven resilient across many economic environments and should continue to do so.
As direct lending market share grows, lenders will be able to finance increasingly larger businesses and, as a result, the quality of direct lending portfolios should continue to improve. Even still, differentiation across managers should become increasingly apparent and scaled, well-established platforms should outperform over time. We are confident Blue Owl is poised to deliver solid risk-adjusted returns to our stakeholders due to our broad origination footprint, prudent asset selection, conservative structuring and focus on capital preservation.
Craig Packer, Co-President & Head of Credit


By Michael Rees, Co-President, Head of GP Strategic Capital
& Sean Ward, Senior Managing Director
For over a decade, our GP Strategic Capital platform has been at the forefront of providing innovative, long-term minority equity and financing solutions to leading private capital managers. As we reflect on the last twelve months, alternative assets remain an important component of multi-asset portfolios, as investors can look to hedge against public markets and mitigate portfolio asset value volatility. We have seen private capital fundraising and realizations from underlying portfolios have both significantly slowed industry-wide, our diverse portfolios of stakes in large, institutionalized private capital firms have continued to produce both cash flow and capital appreciation. Looking ahead to 2024, we believe that the private market is positioned to continue to provide opportunities for the success of the strategy.
Considering the coming year, we offer five key investment themes for the private capital industry broadly, and GP stakes specifically, in 2024.
1. Private equity remains a dominant private capital asset class
We believe private equity remains one of the dominant private capital asset classes in North America. Private equity assets under management are expected to reach $8.5 trillion by 2028, which represents a 10% compound annualized growth rate in the period from 2022 to 20281. As of year-end 2022, private equity AUM was $4.8 trillion.1 Private equity experienced rapid growth, particularly in buyout strategies, between the start of 2019 and the third quarter of 2022, growing at a compound annual growth rate (CAGR) of 22%, compared with the global average of 18.4%.2
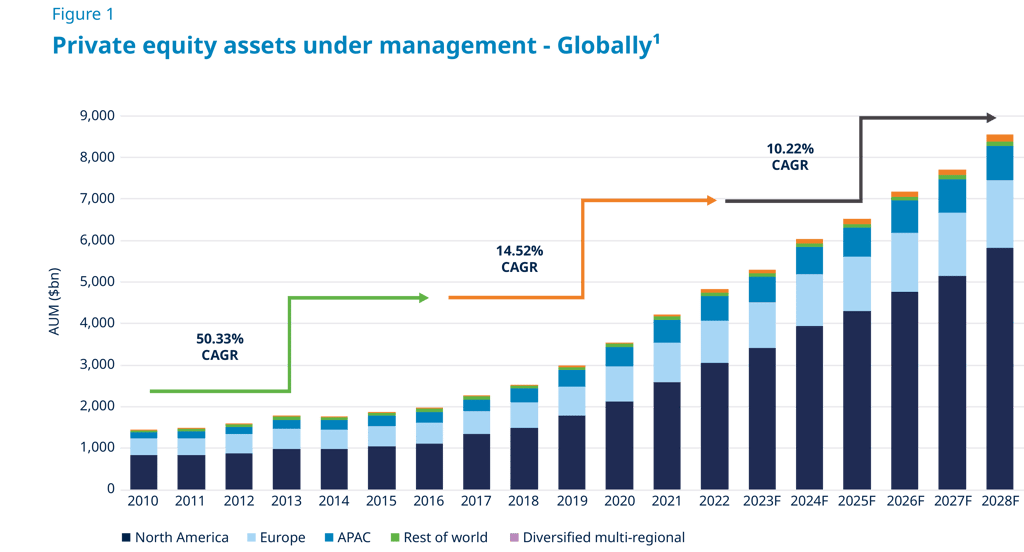
North America-based funds are forecasted to reach $5.8 trillion in 2028, which is equivalent to 68.1% of the global private equity market in 2028, compared with 64.3% in 2023.1 We are excited to continue to watch this market grow into the future.
2. Larger managers are proving to be resilient
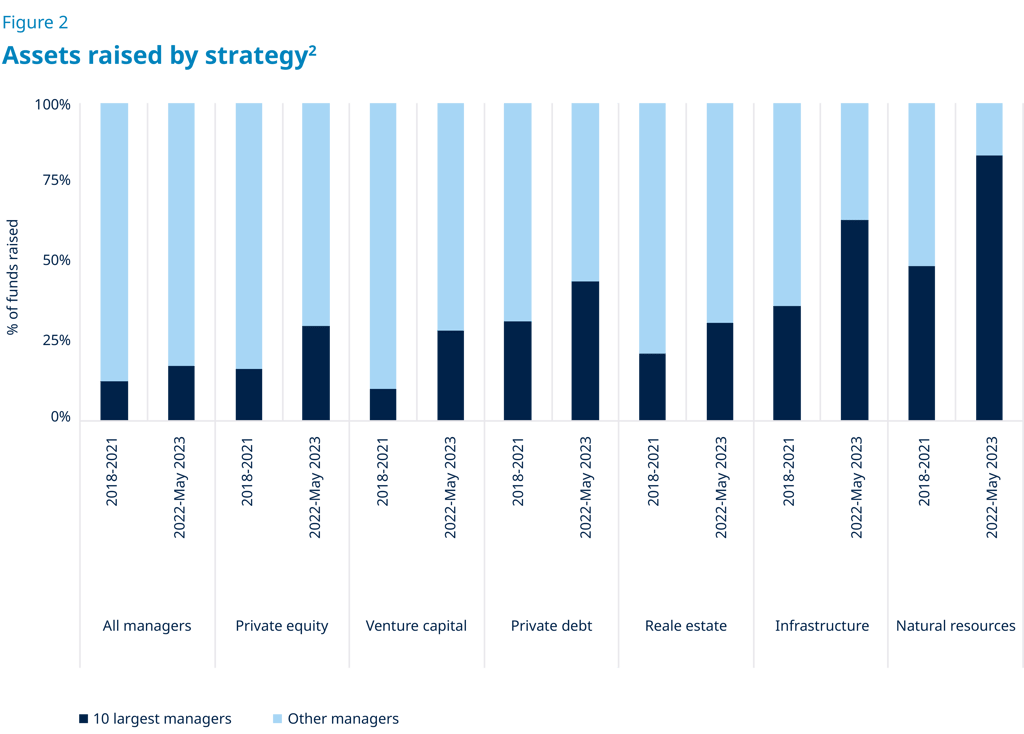
The overall fundraising decline has been partially offset by a shift in assets to larger, more established, “brand-name” firms.1 Funds raised by the ten largest managers increased in every asset class between 2018 and 2021, and from 2022 to May 2023.2 For example, the ten largest managers in private equity took 30% of LP commitments in the latter period, an increase from 17% in 2018 to 2022.2
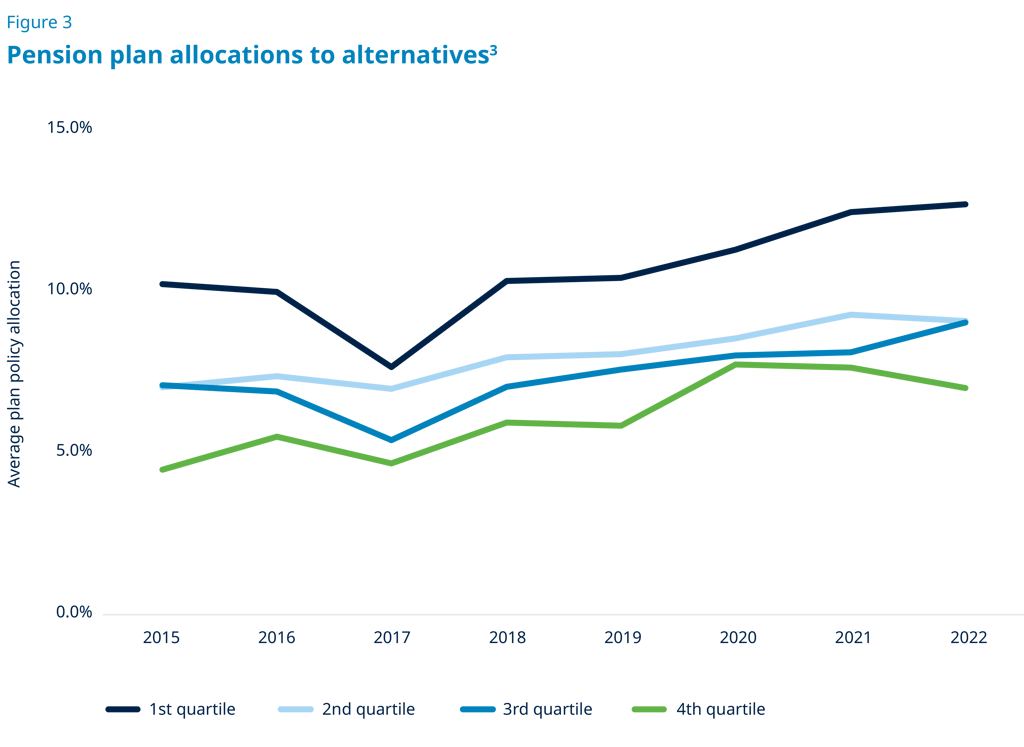
Additionally, we believe that large pension plans are not likely to reduce their allocations to their larger partners, as many investors are likely seeking to concentrate their manager relationships across strategies and, in many cases, asset classes. The data below supports this conclusion as the average target allocation across all asset classes for most public pensions has increased since 2017, but more so for the largest plans.2 As of the 2022 plan year, the average target private equity allocation for the top quartile was 13%, an increase from 9% in the 2017 plan year.2
3. Active asset management is key to consistent outperformance
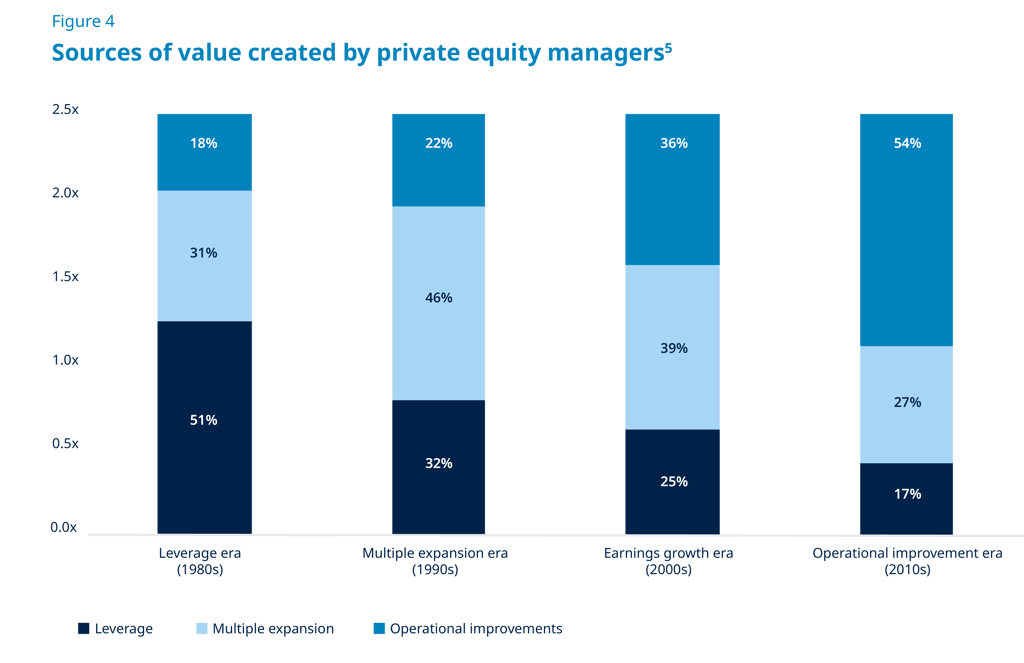
Leading private markets managers historically focus on fundamental operational transformation in seeking to generate alpha. Approximately 80% of fund managers with more than $10 billion in AUM engage in value creation planning before making the decision to invest.4 Despite widespread misconceptions to the contrary, leverage as a source of private equity value creation has declined over time, leaving room for operational improvements to grow as the main generator of returns.5 We expect this trend to continue into 2024, creating the possibility for outsized performance for many private market managers who field large operational/value creation teams.
4. M&A is an accelerating trend
Large asset managers seek to expand their product offerings and increase AUM. This growth is typically created organically, by launching new funds with internal teams. Recently, however, the pace of M&A activity among private markets firms has increased substantially, driven by multiple motivations, including enhancing the scale and global presence of a firm or filling product gaps through targeted acquisitions or team lift-outs. M&A also provides traditional asset managers the opportunity to expand into private markets or new geographies more quickly and efficiently than attempting to launch new products in the face of a challenging fundraising environment. Nuveen’s recent acquisition of Arcmont, a leading European private credit business (and Blue Owl GP Stakes Fund IV’s partner manager), is an illustration of this trend.
Other recent strategic M&A across our partner base includes CVC acquiring Glendower Capital and DIF Infrastructure, as well as Bridgepoint acquiring EQT’s credit business as well as ECP. We believe this trend will continue in 2024.
5. The retail channel remains under-allocated to private markets
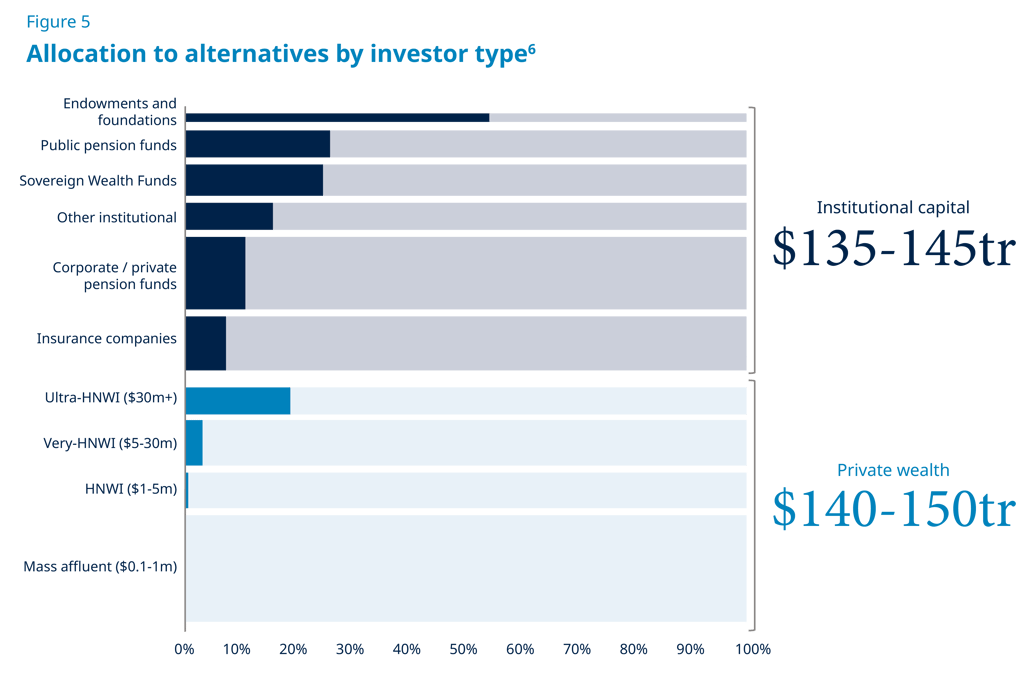
The retail channel remains a vast, largely untapped market that can be increasingly attractive to alternative asset managers seeking to sustain double-digit growth. Individual investors hold roughly 50% of the estimated $275 trillion to $295 trillion of global assets currently under management, yet these same investors represent just 16% of AUM held by alternative investment funds.6 This disjunction alone can be a strong motivation for alternative managers to launch funds that can provide high-net-worth individuals access to various alternative asset classes. We further believe that large, institutionalized firms can benefit the most, at least in early days, from increased retail investment, as these firms may have the resources to build-out the necessary infrastructure to address the manifold sales. Due to operational and regulatory complexities for this investor base, brand recognition may be the driving force to attract early investors.
Conclusion
Even through a year of slower growth and fundraising, we believe that Blue Owl’s GP Strategic Capital platform continues to be a partner of choice for both investors and managers. For fund investors, our strategy provided cash flow and access to the GP economics of a diversified set of leading private market managers spanning multiple asset classes, strategies and geographies around the world. For managers, bringing in a minority partner can provide an infusion of liquidity that can be used for various corporate purposes, as well as expertise, strategic guidance and access to invaluable networks through our Business Services Platform. We believe that our tenure and track record demonstrate that we are well-positioned to capitalize on the market opportunities having raised over 60% of capital raised by the ten largest funds pursuing our strategy7 and having closed over 85% of transactions ever completed.8 While no one can predict the future, we continue to believe that a strategy focused on acquiring minority stakes in a diversified set of leading, highly-profitable private capital firms can continue to perform well through many market cycles.
Michael Rees, Co-President, Head of GP Strategic Capital & Sean Ward, Senior Managing Director


By Marc Zahr, Co-President, Head of Real Estate
2023 presented several challenges for most real estate managers – a theme we expect to carry over into 2024 as higher interest rates, limited credit availability, and persistent inflation may continue to apply negative pressure to existing portfolios and limit the ability of managers to raise and invest new capital. While we expect many firms will be working to rebalance their portfolios, Blue Owl is well positioned to deploy over $5 billion in dry powder and to act on the best buying opportunity we have seen in two decades. In particular, there are three themes we anticipate being prevalent in private equity real estate throughout 2024.
1. A perfect storm in sale leasebacks: attractive supply/demand dynamics continue
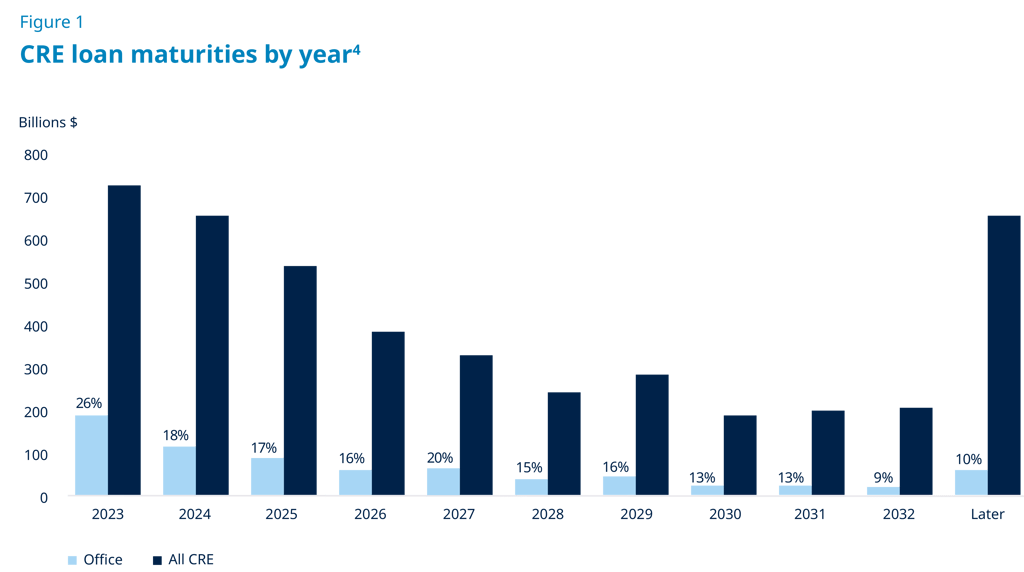
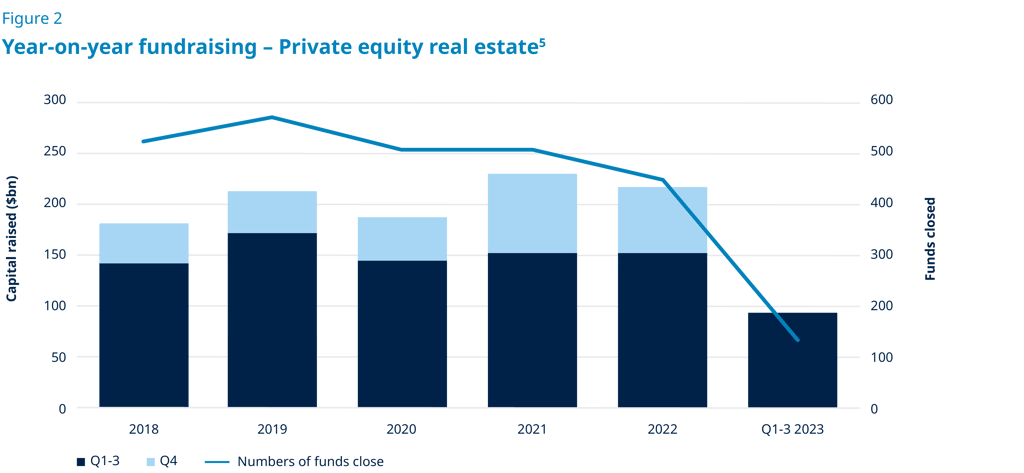
We believe real estate investors face a number of challenges in the current macro environment. Real estate transaction volume declined over 50% in 2023 and remains low as many investors are likely finding it increasingly difficult to successfully deploy capital in a high interest rate environment with fewer debt providers actively lending in this market.1 At the same time, those lenders that are providing new capital have tightened their already stringent underwriting standards and are exercising caution over which deals they finance while simultaneously preparing for the mountain of looming debt maturities that will soon become reality.1 In the next three years, an estimated $2 trillion of commercial real estate loans will reach maturity, causing many industry experts to conclude the worst has yet to come as room exists for portfolio deterioration to continue, especially for those with office space exposure.2 Investors’ hesitation to allocate new capital towards real estate investments is evidenced by the fact that 2023 is expected to be recorded as the lowest annual commercial real estate fundraising total since 2012.3
Having acknowledged the current challenges and emerging distress in the market, we feel strongly this will present compelling investment opportunities for investors adopting Sam Zell’s “gravedancer” mentality of reviving deteriorating investments. While others may be focusing on the problems in their existing portfolios, Blue Owl Real Estate is in the early innings of pursuing what we believe to be one of the best buying opportunities we have seen since our founding. We would argue that a corporation’s need for liquidity is more crucial than ever in today’s economy, and we are seeing many firms turning to sale-leaseback transactions to access capital and to finance their various business initiatives. We believe we have developed a niche for ourselves in the industry as a flexible and creative capital solutions provider that can transact at scale. Our proactive investment sourcing approach of developing direct relationships with companies and their most trusted advisors has created more unique and bespoke opportunities for Blue Owl Real Estate than one may see in the brokered market. Our expertise is centered around problem solving and presenting solutions to company decision-makers with the goal of helping them optimize their balance sheets and utilize their own capital more efficiently. Rather than just executing a standard real estate transaction, we are serving as a capital solutions provider to the company, which is how we have been able to meaningfully drive attractive pricing and deal terms. Our ability to buy assets at considerable spreads to the broader market has resulted in steady valuation growth in our existing portfolios and has also allowed for more opportunity to monetize assets with compression, even in this environment.
We believe that sentiment has resonated with investors as Blue Owl Real Estate has been able to raise over $7 billion of new capital in the last 18 months, notwithstanding an extremely difficult fundraising environment. Additionally, we have closed or placed under contract approximately $8 billion of real estate in the last 12 months and expect to continue that trajectory in 2024 given the increased need for capital and the significant amount of dry powder we have available.
2. Opportunities at the top: scaled managers capitalizing on the onshoring trend
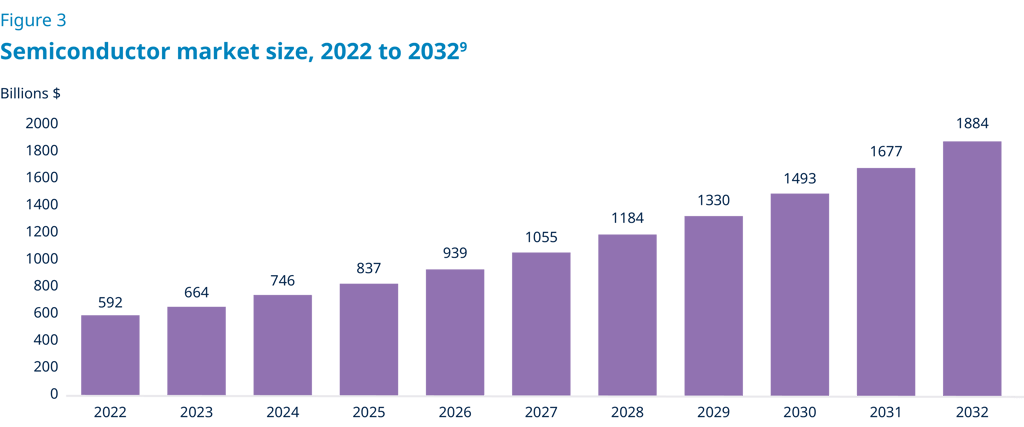
As geopolitical tensions and supply chain issues continue to dominate headlines, we’ve noticed companies elevating “onshoring” to the top of their priority list. This trillion-dollar movement to bring manufacturing back to the U.S. from overseas should enable companies to reduce their exposure to and dependence on the global economy. Separate from the more publicized geopolitical conflicts happening around the world, there is another “war” happening in our own backyard – the so-called Chip War.6
Geopolitical power, measured in military and economic might and influence, is built upon a foundation of semiconductors and microchips which stand as arguably the world’s most critical technologies. This trillion-dollar industry has been identified as a national security issue for the United States as only 12% of semiconductor chips are manufactured in the U.S.6 Meanwhile, Taiwan is currently the center of gravity in the microchip ecosystem, producing over 60% of the world’s semiconductors and over 90% of the most advanced semiconductors. Taiwan’s outsized weighting as a producer of this critical technology, combined with China’s political aggression in the region, may represent a critical risk for the United States and companies globally. 7
The onshoring trend is not a brief investment opportunity or moment in time; it has the potential to be a transformational manufacturing renaissance in the United States. We believe we are entering an era of firms developing multi-billion-dollar facilities and investing significant dollars into infrastructure and supply chain improvements. The chip industry now produces in one year more transistors than the combined quantity of all goods produced by all other companies in all other industries in all of human history.8
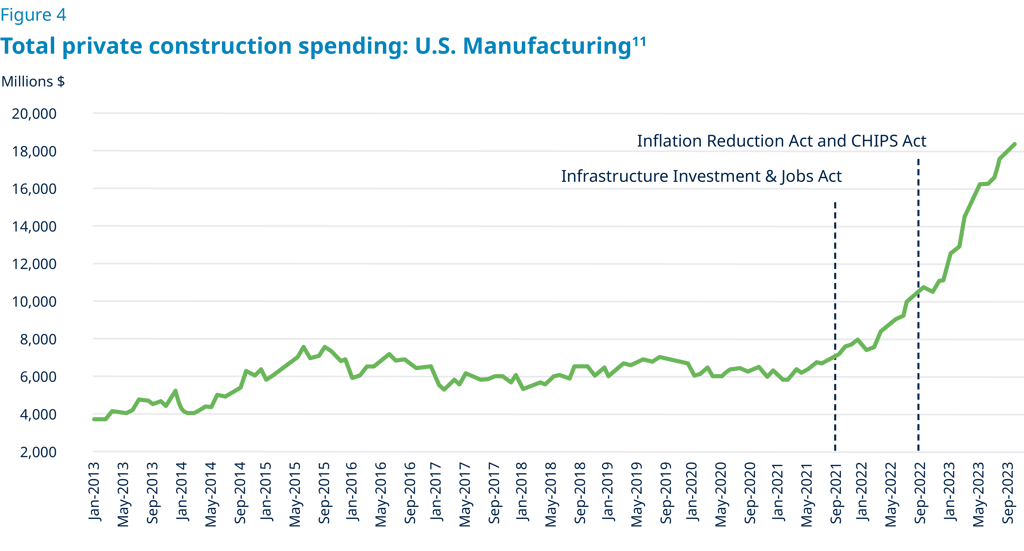
Leading technology companies such as Intel, Micron, and Samsung have been at the forefront of the movement as they look to create advanced semiconductor and chip manufacturing facilities. President Biden has announced multiple government incentives, including the Inflation Reduction Act, the Infrastructure Investment and Jobs Act and the CHIPS and Science Act, to encourage companies to “Invest in America”.9 However, we believe these incentives don’t even scratch the surface of what may be required to build out leading edge chip fabrication facilities which can cost in excess of $25 billion.10 A substantial amount of private capital is likely going to be needed to fill the gap.
We believe the significant capital need has led companies to strongly consider sale-leaseback transactions to help finance the projects and this movement has created a significant pipeline of investment opportunities for Blue Owl Real Estate. Considering the sheer scale of these developments, we believe there are very few groups that can provide the capital and depth of partnership for these types of transactions the way Blue Owl Real Estate’s platform has proven to do. We have been able to establish ourselves as a knowledgeable, creative, and flexible capital solutions provider which we believe positions us as a partner of choice.
As such, these assets will not only be mission critical to the companies themselves, but more importantly, they are expected to be critical to the economy of the United States. This aligns well with the investment thesis that Blue Owl Real Estate has maintained since Day 1 of targeting a company’s most mission critical assets. We believe our long-standing track record of success, coupled with billions in available investment capital, positions us to take advantage of these opportunities in the near term.
3. Net lease remains well-positioned in today’s environment
As investors continue to face ongoing uncertainty, we believe net lease transactions should become more appealing to both buyers and sellers. From a seller’s perspective, disposing of real estate can be a way to access liquidity to fuel growth or more efficiently utilize their capital. A substantial amount of value locked up in real estate may not be the highest or best use of capital. From a buyer’s perspective, investors can access an income-generating asset with the potential for lower volatility and the potential for additional diversification. The net lease structure seeks to provide inflation protection through its insulation from operating expenses for the buyer, as expenses in a triple net structure are the responsibility of the tenant. The structure looks and feels very similar to a bond but seeks to provide additional capital preservation through the real estate serving as collateral.
Blue Owl Real Estate’s sole focus since launching in 2009 has been pursuing net lease transactions. The structure of our triple net leases seeks to insulate us from rising expenses and delivers a predictable income stream to our investors. We believe stability and predictability of returns are top of mind for investors in today’s market, which has translated to meaningful demand for net lease real estate investments. Blue Owl’s net lease real estate strategy has maintained the singular focus of providing attractive risk-adjusted returns through long-term, contractual cash flow by acquiring mission-critical real estate backed by investment grade or creditworthy entities.12 Our stringent investment criteria has allowed our strategy to perform well in varying economic environments, and we believe the strategy continues to be well positioned to pursue favorable yields and total returns for our investors for the foreseeable future.
Conclusion
Despite the noted macroeconomic and geopolitical disruptions, today’s market may present one of the most attractive investment opportunities for net lease real estate strategies. Blue Owl’s bespoke approach to origination and ability to transact in off-market deal flow enables us to act on opportunities that we believe are unavailable to most participants. We believe the need for flexible and reliable capital providers combined with our scale, speed and certainty of execution, make Blue Owl a partner of choice, attributes we look forward to continuing as we enter 2024.
Marc Zahr, Co-President, Head of Real Estate


By Craig Packer, Co-President, Head of Credit
At this time last year, we were cautious about what lay ahead for the economy and our borrowers. Inflation was stubbornly high, public markets were volatile and a soft landing seemed aspirational. This environment bore several risks, but, in our view, it also brought some unique opportunities. Dislocation in public credit markets meant that direct lenders financed the majority of the private equity-driven deal flow.1 We also observed spreads at all-time highs for new deals with conservative leverage and strong credit quality. As existing portfolio companies continued to perform well despite higher interest burdens and direct lending fund returns across the industry followed suit, we believe the asset class received further validation of its staying power and durability.
Sitting here one year later, key indicators reflect a decidedly more positive economic backdrop. Inflation is waning, employment remains strong2 and Fed policy seems to be heading into an easing cycle. That said, we remain vigilant of potential tail risks arising from higher borrowing costs and a potential retreat in economic growth. We also expect that substantial pent-up M&A demand should yield a more active deal environment. As such, we believe scaled capital providers that can speak for size, deliver a full suite of financing solutions, and remain consistently active in direct lending across the market cycle, are best-positioned to lead high-quality deals and deliver strong risk-adjusted returns.
In this piece, we present five themes that we think will characterize the direct lending market in 2024.
1. Direct lending continues to outperform other asset classes
The direct lending asset class is benefitting from an elevated interest rate environment and is currently generating record returns. In contrast to fixed income, the floating rate nature of loans increases their earnings power as rates increase. In 2023, direct lending returns rose +8.9%, as compared to –2.2% and +5.9% for traditional fixed income and high yield, respectively. Even as Fed policy is expected to ease this year, rates are likely to remain comfortably above their levels before the recent hiking cycle. Further, direct lending has historically outperformed competing markets during “flat-to-falling” interest rate cycles.3
While leveraged loan returns should also benefit from the higher rate environment, we believe direct lending is poised to outperform the syndicated loan market, particularly on a risk-adjusted basis. Less cyclical sector orientation, simpler capital structures, capital preservation features, private equity-style due diligence, in-house workout capabilities and higher equity cushions all facilitate lower default and loss rates relative to the syndicated loan market.
2. Pent-up demand for M&A should yield a healthy deal environment in 2024
Light investment and exit activity over the last twelve months have generated substantial pent-up demand for M&A.1 This should create a more active deal environment this year as the rate outlook stabilizes and markets return to normalcy. In addition, private equity firms have ample dry powder to deploy and will be motivated to return capital to investors after a period of limited distributions. We anticipate an increase in sponsor-to-sponsor LBOs and refinancings, which were quiet in 2023 but have begun to come back. We also expect a continued steady flow of take-privates, corporate carveouts and tack-on acquisitions for existing portfolio companies.
Large platforms that have a long direct lending track record may also benefit from incumbency positions, in which they provide incremental capital to existing borrowers, as portfolio companies trade hands or make transformative acquisitions. Last year, over 40% of our new deals were made with existing partners, and we expect this percentage to grow over time.
Spreads on new deals have tightened from highs at the beginning of 2023. This has come alongside the further reopening of public credit markets and an influx of capital into direct lending.1 However, we expect absolute returns will remain compelling as benchmark rates remain high. Many new deals are also coming at lower leverage and loan-to-values than in prior years, resulting in improved risk-adjusted return profiles.
Finally, we expect repayments will increase alongside ramping deal activity. This should increase direct lending fund returns as loans are repaid at par and, in certain instances, call protection premia are collected.
3. Borrowers should continue to perform well amidst an improving macroeconomic backdrop
Borrowers have been resilient amidst an inflationary and rising rate backdrop. While this is partly driven by continued strength of the economy at large, we feel it is also supported by our focus on scaled, high-quality borrowers. Indeed, average EBITDA across our direct lending platform is over $200 million.8 We believe such businesses are better positioned than traditional middle market companies by virtue of their diversification, strategic significance in their industries, greater operating leverage, and ability to withstand unforeseen cost pressures.
Our portfolio is also skewed toward durable end markets such as software, healthcare and food & beverage. Across most sectors in which we invest, we have observed low-to-mid single digit quarterly revenue and earnings growth. Margins have improved in recent months as inflation wanes, price increases are realized and companies proactively cut costs. We expect borrowers to demonstrate continued resilience this year.
Even in a sustained elevated-rate environment, we anticipate the vast majority of borrowers will maintain more than adequate cash cushions. While a small number could experience liquidity pressures, we believe we are largely insulated by ~60% average equity cushions beneath our debt and private equity firms’ demonstrated ability and willingness to support their investments with additional capital when needed. Finally, we expect that any modest increase in losses will be more than offset by the earnings accretion of our funds from higher benchmark rates.
4. The long-term opportunity for direct lending continues to grow
We believe the direct lending asset class is still in the early innings of growth. Today, it represents only approximately 20-25% of the leveraged finance market with potential to grow to 35%+ over the next several years.11 This growth is driven by both ‘supply’ and ‘demand’ factors. Direct lending presents an attractive value proposition for end investors and users of capital, both of which should continue to support the upward momentum of the asset class.
From a ‘supply’ perspective, we believe direct lending is more commonly becoming a strategic, rather than tactical, portfolio allocation. It seeks to deliver consistent yield that is not correlated to public markets. At the same time, ‘demand’ has increased as we have observed companies becoming more comfortable choosing private financing over public markets execution. In our view, sponsors appreciate the predictability, flexibility, privacy and partnership approach of private loans. Not only can direct lenders speak for large size on deals, but they can also offer a full range of solutions across the capital stack.
Direct lending was an outsized beneficiary of market volatility in 2023. With public credit markets effectively closed, direct lenders financed 86% of leveraged buyouts last year.7 Even as public credit markets return, we believe this share shift toward direct lending will likely continue.
5. Managers differentiate with scale and strength of sponsor relationships
We believe scaled direct lenders are better positioned to succeed than sub-scale capital providers by virtue of their deep origination capabilities, strong sector-specialized underwriting expertise, in-house portfolio management, and workout and fund financing capabilities. Because they can write large checks and are strategically relevant to their counterparties, bigger managers typically receive better access to deal flow and can be highly selective on credit selection and deal terms. While there have been many new entrants to the space in recent years, several of which have traditional private equity, distressed or public markets heritage, we believe scaled pure-play providers that focus on direct lending across the market cycle and employ a partnership-based approach will likely continue to be a ‘first call’ on deals. In an asset class in which the best possible outcome is to recoup full principal and interest payments, top-tier manager returns are driven by capital preservation and low loss rates – not stretching for higher asset-level yields on riskier deals.
Conclusion
Looking ahead to 2024, we believe the new deal opportunity set should remain attractive, existing portfolio companies should perform well, and direct lending funds should continue to generate strong returns. We have heard many laud this time as the “golden age” of private credit, while others are cautious about how the asset class will fare. We hold a more nuanced perspective. While today’s market is attractive, and we expect it to remain so for the near-term, we do not believe one can, or should, perfectly time the market. A long-term allocation to direct lending should provide a compelling risk-adjusted return to investors across the cycle regardless of short-term vagaries in the market. Further, we believe the asset class has thus far proven resilient across many economic environments and should continue to do so.
As direct lending market share grows, lenders will be able to finance increasingly larger businesses and, as a result, the quality of direct lending portfolios should continue to improve. Even still, differentiation across managers should become increasingly apparent and scaled, well-established platforms should outperform over time. We are confident Blue Owl is poised to deliver solid risk-adjusted returns to our stakeholders due to our broad origination footprint, prudent asset selection, conservative structuring and focus on capital preservation.
Craig Packer, Co-President & Head of Credit
By Michael Rees, Co-President, Head of GP Strategic Capital
& Sean Ward, Senior Managing Director
For over a decade, our GP Strategic Capital platform has been at the forefront of providing innovative, long-term minority equity and financing solutions to leading private capital managers. As we reflect on the last twelve months, alternative assets remain an important component of multi-asset portfolios, as investors can look to hedge against public markets and mitigate portfolio asset value volatility. We have seen private capital fundraising and realizations from underlying portfolios have both significantly slowed industry-wide, our diverse portfolios of stakes in large, institutionalized private capital firms have continued to produce both cash flow and capital appreciation. Looking ahead to 2024, we believe that the private market is positioned to continue to provide opportunities for the success of the strategy.
Considering the coming year, we offer five key investment themes for the private capital industry broadly, and GP stakes specifically, in 2024.
1. Private equity remains a dominant private capital asset class
We believe private equity remains one of the dominant private capital asset classes in North America. Private equity assets under management are expected to reach $8.5 trillion by 2028, which represents a 10% compound annualized growth rate in the period from 2022 to 20281. As of year-end 2022, private equity AUM was $4.8 trillion.1 Private equity experienced rapid growth, particularly in buyout strategies, between the start of 2019 and the third quarter of 2022, growing at a compound annual growth rate (CAGR) of 22%, compared with the global average of 18.4%.2
North America-based funds are forecasted to reach $5.8 trillion in 2028, which is equivalent to 68.1% of the global private equity market in 2028, compared with 64.3% in 2023.1 We are excited to continue to watch this market grow into the future.
2. Larger managers are proving to be resilient
The overall fundraising decline has been partially offset by a shift in assets to larger, more established, “brand-name” firms.1 Funds raised by the ten largest managers increased in every asset class between 2018 and 2021, and from 2022 to May 2023.2 For example, the ten largest managers in private equity took 30% of LP commitments in the latter period, an increase from 17% in 2018 to 2022.2
Additionally, we believe that large pension plans are not likely to reduce their allocations to their larger partners, as many investors are likely seeking to concentrate their manager relationships across strategies and, in many cases, asset classes. The data below supports this conclusion as the average target allocation across all asset classes for most public pensions has increased since 2017, but more so for the largest plans.2 As of the 2022 plan year, the average target private equity allocation for the top quartile was 13%, an increase from 9% in the 2017 plan year.2
3. Active asset management is key to consistent outperformance
Leading private markets managers historically focus on fundamental operational transformation in seeking to generate alpha. Approximately 80% of fund managers with more than $10 billion in AUM engage in value creation planning before making the decision to invest.4 Despite widespread misconceptions to the contrary, leverage as a source of private equity value creation has declined over time, leaving room for operational improvements to grow as the main generator of returns.5 We expect this trend to continue into 2024, creating the possibility for outsized performance for many private market managers who field large operational/value creation teams.
4. M&A is an accelerating trend
Large asset managers seek to expand their product offerings and increase AUM. This growth is typically created organically, by launching new funds with internal teams. Recently, however, the pace of M&A activity among private markets firms has increased substantially, driven by multiple motivations, including enhancing the scale and global presence of a firm or filling product gaps through targeted acquisitions or team lift-outs. M&A also provides traditional asset managers the opportunity to expand into private markets or new geographies more quickly and efficiently than attempting to launch new products in the face of a challenging fundraising environment. Nuveen’s recent acquisition of Arcmont, a leading European private credit business (and Blue Owl GP Stakes Fund IV’s partner manager), is an illustration of this trend.
Other recent strategic M&A across our partner base includes CVC acquiring Glendower Capital and DIF Infrastructure, as well as Bridgepoint acquiring EQT’s credit business as well as ECP. We believe this trend will continue in 2024.
5. The retail channel remains under-allocated to private markets
The retail channel remains a vast, largely untapped market that can be increasingly attractive to alternative asset managers seeking to sustain double-digit growth. Individual investors hold roughly 50% of the estimated $275 trillion to $295 trillion of global assets currently under management, yet these same investors represent just 16% of AUM held by alternative investment funds.6 This disjunction alone can be a strong motivation for alternative managers to launch funds that can provide high-net-worth individuals access to various alternative asset classes. We further believe that large, institutionalized firms can benefit the most, at least in early days, from increased retail investment, as these firms may have the resources to build-out the necessary infrastructure to address the manifold sales. Due to operational and regulatory complexities for this investor base, brand recognition may be the driving force to attract early investors.
Conclusion
Even through a year of slower growth and fundraising, we believe that Blue Owl’s GP Strategic Capital platform continues to be a partner of choice for both investors and managers. For fund investors, our strategy provided cash flow and access to the GP economics of a diversified set of leading private market managers spanning multiple asset classes, strategies and geographies around the world. For managers, bringing in a minority partner can provide an infusion of liquidity that can be used for various corporate purposes, as well as expertise, strategic guidance and access to invaluable networks through our Business Services Platform. We believe that our tenure and track record demonstrate that we are well-positioned to capitalize on the market opportunities having raised over 60% of capital raised by the ten largest funds pursuing our strategy7 and having closed over 85% of transactions ever completed.8 While no one can predict the future, we continue to believe that a strategy focused on acquiring minority stakes in a diversified set of leading, highly-profitable private capital firms can continue to perform well through many market cycles.
Michael Rees, Co-President, Head of GP Strategic Capital & Sean Ward, Senior Managing Director
By Marc Zahr, Co-President, Head of Real Estate
2023 presented several challenges for most real estate managers – a theme we expect to carry over into 2024 as higher interest rates, limited credit availability, and persistent inflation may continue to apply negative pressure to existing portfolios and limit the ability of managers to raise and invest new capital. While we expect many firms will be working to rebalance their portfolios, Blue Owl is well positioned to deploy over $5 billion in dry powder and to act on the best buying opportunity we have seen in two decades. In particular, there are three themes we anticipate being prevalent in private equity real estate throughout 2024.
1. A perfect storm in sale leasebacks: attractive supply/demand dynamics continue
We believe real estate investors face a number of challenges in the current macro environment. Real estate transaction volume declined over 50% in 2023 and remains low as many investors are likely finding it increasingly difficult to successfully deploy capital in a high interest rate environment with fewer debt providers actively lending in this market.1 At the same time, those lenders that are providing new capital have tightened their already stringent underwriting standards and are exercising caution over which deals they finance while simultaneously preparing for the mountain of looming debt maturities that will soon become reality.1 In the next three years, an estimated $2 trillion of commercial real estate loans will reach maturity, causing many industry experts to conclude the worst has yet to come as room exists for portfolio deterioration to continue, especially for those with office space exposure.2 Investors’ hesitation to allocate new capital towards real estate investments is evidenced by the fact that 2023 is expected to be recorded as the lowest annual commercial real estate fundraising total since 2012.3
Having acknowledged the current challenges and emerging distress in the market, we feel strongly this will present compelling investment opportunities for investors adopting Sam Zell’s “gravedancer” mentality of reviving deteriorating investments. While others may be focusing on the problems in their existing portfolios, Blue Owl Real Estate is in the early innings of pursuing what we believe to be one of the best buying opportunities we have seen since our founding. We would argue that a corporation’s need for liquidity is more crucial than ever in today’s economy, and we are seeing many firms turning to sale-leaseback transactions to access capital and to finance their various business initiatives. We believe we have developed a niche for ourselves in the industry as a flexible and creative capital solutions provider that can transact at scale. Our proactive investment sourcing approach of developing direct relationships with companies and their most trusted advisors has created more unique and bespoke opportunities for Blue Owl Real Estate than one may see in the brokered market. Our expertise is centered around problem solving and presenting solutions to company decision-makers with the goal of helping them optimize their balance sheets and utilize their own capital more efficiently. Rather than just executing a standard real estate transaction, we are serving as a capital solutions provider to the company, which is how we have been able to meaningfully drive attractive pricing and deal terms. Our ability to buy assets at considerable spreads to the broader market has resulted in steady valuation growth in our existing portfolios and has also allowed for more opportunity to monetize assets with compression, even in this environment.
We believe that sentiment has resonated with investors as Blue Owl Real Estate has been able to raise over $7 billion of new capital in the last 18 months, notwithstanding an extremely difficult fundraising environment. Additionally, we have closed or placed under contract approximately $8 billion of real estate in the last 12 months and expect to continue that trajectory in 2024 given the increased need for capital and the significant amount of dry powder we have available.
2. Opportunities at the top: scaled managers capitalizing on the onshoring trend
As geopolitical tensions and supply chain issues continue to dominate headlines, we’ve noticed companies elevating “onshoring” to the top of their priority list. This trillion-dollar movement to bring manufacturing back to the U.S. from overseas should enable companies to reduce their exposure to and dependence on the global economy. Separate from the more publicized geopolitical conflicts happening around the world, there is another “war” happening in our own backyard – the so-called Chip War.6
Geopolitical power, measured in military and economic might and influence, is built upon a foundation of semiconductors and microchips which stand as arguably the world’s most critical technologies. This trillion-dollar industry has been identified as a national security issue for the United States as only 12% of semiconductor chips are manufactured in the U.S.6 Meanwhile, Taiwan is currently the center of gravity in the microchip ecosystem, producing over 60% of the world’s semiconductors and over 90% of the most advanced semiconductors. Taiwan’s outsized weighting as a producer of this critical technology, combined with China’s political aggression in the region, may represent a critical risk for the United States and companies globally. 7
The onshoring trend is not a brief investment opportunity or moment in time; it has the potential to be a transformational manufacturing renaissance in the United States. We believe we are entering an era of firms developing multi-billion-dollar facilities and investing significant dollars into infrastructure and supply chain improvements. The chip industry now produces in one year more transistors than the combined quantity of all goods produced by all other companies in all other industries in all of human history.8
Leading technology companies such as Intel, Micron, and Samsung have been at the forefront of the movement as they look to create advanced semiconductor and chip manufacturing facilities. President Biden has announced multiple government incentives, including the Inflation Reduction Act, the Infrastructure Investment and Jobs Act and the CHIPS and Science Act, to encourage companies to “Invest in America”.9 However, we believe these incentives don’t even scratch the surface of what may be required to build out leading edge chip fabrication facilities which can cost in excess of $25 billion.10 A substantial amount of private capital is likely going to be needed to fill the gap.
We believe the significant capital need has led companies to strongly consider sale-leaseback transactions to help finance the projects and this movement has created a significant pipeline of investment opportunities for Blue Owl Real Estate. Considering the sheer scale of these developments, we believe there are very few groups that can provide the capital and depth of partnership for these types of transactions the way Blue Owl Real Estate’s platform has proven to do. We have been able to establish ourselves as a knowledgeable, creative, and flexible capital solutions provider which we believe positions us as a partner of choice.
As such, these assets will not only be mission critical to the companies themselves, but more importantly, they are expected to be critical to the economy of the United States. This aligns well with the investment thesis that Blue Owl Real Estate has maintained since Day 1 of targeting a company’s most mission critical assets. We believe our long-standing track record of success, coupled with billions in available investment capital, positions us to take advantage of these opportunities in the near term.
3. Net lease remains well-positioned in today’s environment
As investors continue to face ongoing uncertainty, we believe net lease transactions should become more appealing to both buyers and sellers. From a seller’s perspective, disposing of real estate can be a way to access liquidity to fuel growth or more efficiently utilize their capital. A substantial amount of value locked up in real estate may not be the highest or best use of capital. From a buyer’s perspective, investors can access an income-generating asset with the potential for lower volatility and the potential for additional diversification. The net lease structure seeks to provide inflation protection through its insulation from operating expenses for the buyer, as expenses in a triple net structure are the responsibility of the tenant. The structure looks and feels very similar to a bond but seeks to provide additional capital preservation through the real estate serving as collateral.
Blue Owl Real Estate’s sole focus since launching in 2009 has been pursuing net lease transactions. The structure of our triple net leases seeks to insulate us from rising expenses and delivers a predictable income stream to our investors. We believe stability and predictability of returns are top of mind for investors in today’s market, which has translated to meaningful demand for net lease real estate investments. Blue Owl’s net lease real estate strategy has maintained the singular focus of providing attractive risk-adjusted returns through long-term, contractual cash flow by acquiring mission-critical real estate backed by investment grade or creditworthy entities.12 Our stringent investment criteria has allowed our strategy to perform well in varying economic environments, and we believe the strategy continues to be well positioned to pursue favorable yields and total returns for our investors for the foreseeable future.
Conclusion
Despite the noted macroeconomic and geopolitical disruptions, today’s market may present one of the most attractive investment opportunities for net lease real estate strategies. Blue Owl’s bespoke approach to origination and ability to transact in off-market deal flow enables us to act on opportunities that we believe are unavailable to most participants. We believe the need for flexible and reliable capital providers combined with our scale, speed and certainty of execution, make Blue Owl a partner of choice, attributes we look forward to continuing as we enter 2024.
Marc Zahr, Co-President, Head of Real Estate


Foreword
Co-CEO Marc Lipschultz shares his views and perspective on the year ahead.
Highlights: 2024 Credit Outlook
Watch Co-President Craig Packer, break down the themes and opportunities for Credit in 2024.
Highlights: 2024 GP Strategic Capital Outlook
Watch Senior Managing Director, Sean Ward, break down the themes and opportunities for GP Strategic Capital in 2024.
Highlights: 2024 Real Estate Outlook
Watch Co-President, Marc Zahr, break down the themes and opportunities for Real Estate in 2024.

