Endnotes
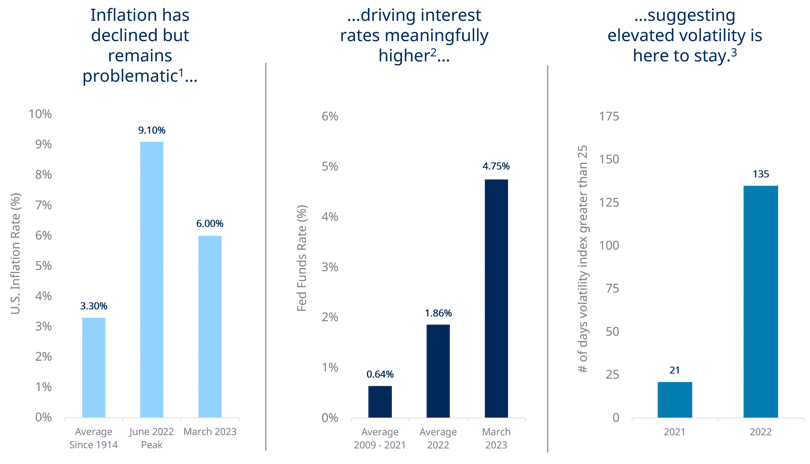
- Bloomberg as of March 1, 2023. Historical average inflation rate represented by all inflation data since reporting began in 1914. Recent peak as of June 30, 2022.
- Bloomberg as of March 1, 2023. Based on upper-bound of the median consensus estimates (Fed Dots) of the Federal Funds Target Rate.
- Bloomberg, S&P Global Market Intelligence as of December 31, 2022. Volatility is measured by the “VIX” which is the Chicago Board Options Exchange Volatility Index. It is designed to be a real-time estimate of the expected volatility of the S&P 500 and is calculated using the mid-point of S&P 500 (SPX) option bid/ask quotes.
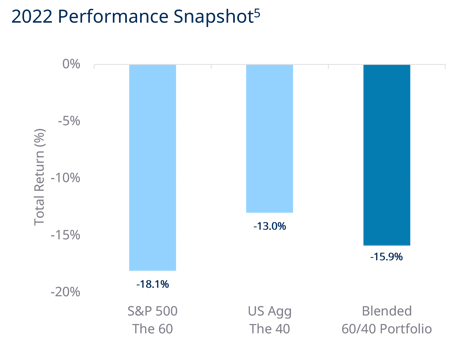
- Bloomberg as of December 31, 2022. A hypothetical portfolio consisting of 60% equities represented by S&P 500 and 40% bonds represented by U.S. Aggregate Bond Index returned -16.9%.
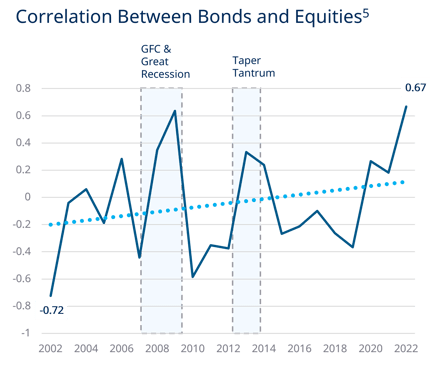
- Bloomberg as of December 31, 2022. Bonds represented by U.S. Aggregate Bond Index, Equities represented by S&P 500.
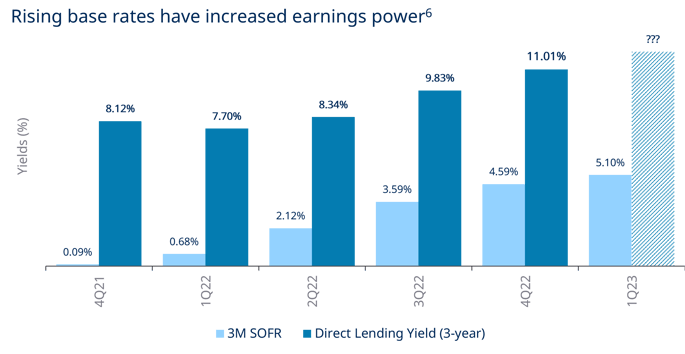
- Cliffwater. “Direct Lending” represented by the Cliffwater Direct Lending Index (CDLI) as of September 30, 2022; Bloomberg. 3-month term SOFR (ticker: TSFR3M Index) as of 03/09/2023.
- Fitch Ratings Ultimate Recovery Rate Study, March 2022.
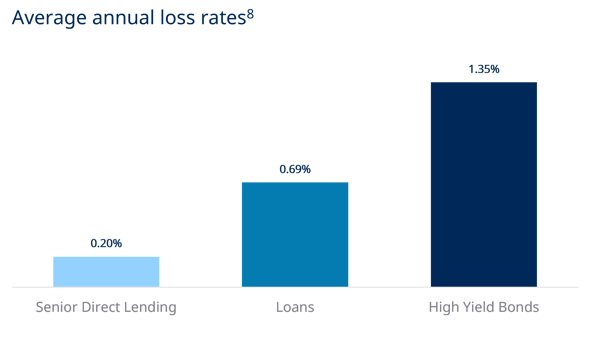
- Average annual loss rates since data for Cliffwater Direct Lending Senior Index began in 2011. Source: SP LCD, Cliffwater, JP Morgan. Market loss rates calculated as average loss rates and defined as: for loans, based on SP LCD default rates for all loan $ defaults as percentage of total outstanding and calculated as default*(1 – average historical Recovery Rate) from 2011 to December 2022; Direct Lending based on Cliffwater Direct Lending Senior Index realized gains/losses from 2011 to December 2022; High Yield Bonds based on JP Morgan Default Monitor annual defaults and calculated as default* (1 – average historical Recovery Rate) from 2011 to December 2022; Recovery rates for loans of range from 48-63% by year and 22-55% for bonds and are based on JP Morgan Default Monitor, February 1, 2022.
- Cliffwater. “Direct Lending” represented by the Cliffwater Direct Lending Index (CDLI), High Yield represented by the Bloomberg Barclays US Corporate High Yield Index, Traded Loans represented by the S&P/LSTA Leveraged Loan Index.
- Cliffwater. “Direct Lending” represented by the Cliffwater Direct Lending Index (CDLI) as of September 30, 2022; Bloomberg: “Equities” represented by the S&P 500 as of September 30, 2022.
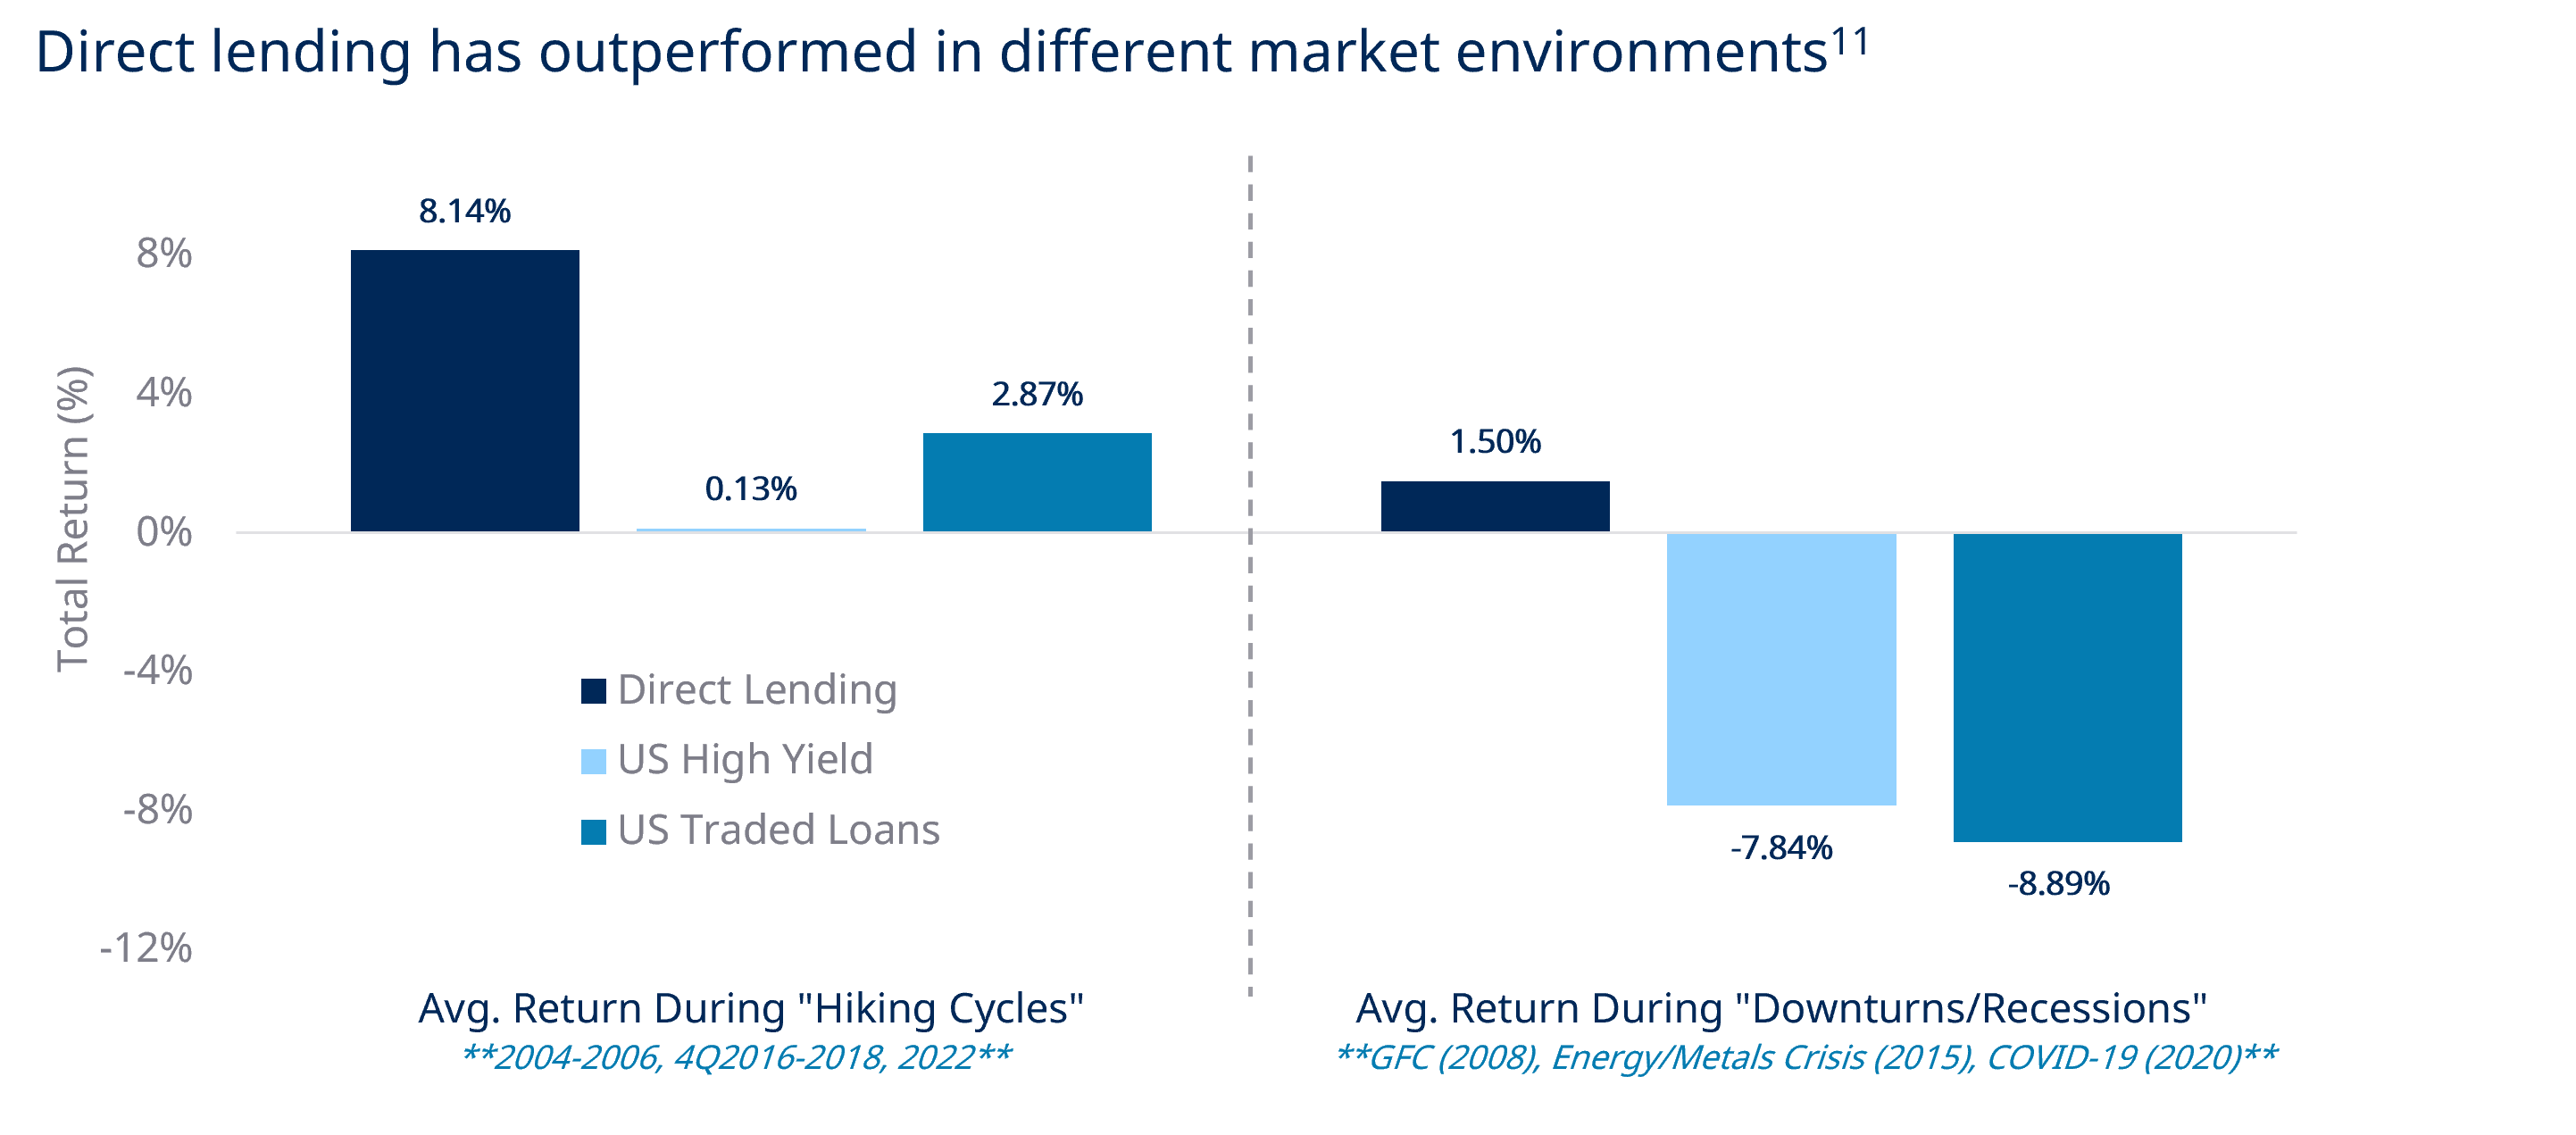
- Data as of December 31, 2022 unless otherwise noted. Sources: “US Traded Loans” represented by the Morningstar LSTA Leveraged Loan Index, “US High Yield” represented by Bloomberg Barclays US High Yield Index, and “US IG Credit” represented the Bloomberg Barclays US Corporate Bond Index. “Direct Lending” represented by the Cliffwater Direct Lending Index as of 09/30/2022.
- Preqin Investor Outlook: Alternative Assets H1 2023.
Important information
Unless otherwise noted the Report Date referenced herein is as of December 31, 2024.
Past performance is not a guarantee of future results.
Assets Under Management (“AUM”) refers to the assets that we manage and is generally equal to the sum of (i) net asset value (“NAV”); (ii) drawn and undrawn debt; (iii) uncalled capital commitments; (iv) total managed assets for certain Credit and Real Assets products; and (v) par value of collateral for collateralized loan obligations (“CLOs”) and other securitizations.
The webpage presented is proprietary information regarding Blue Owl Capital Inc. (“Blue Owl”), its affiliates and investment program, funds sponsored by Blue Owl, including the Blue Owl Credit, GP Strategic Capital Funds and the Real Assets Funds (collectively the “Blue Owl Funds”) as well as investment held by the Blue Owl Funds.
An investment in the Fund or other investment vehicle entails a high degree of risk. Prospective investors should consider all of the risk factors set forth in the "Certain Risk Factors and Actual and Potential Conflicts of Interest" of the PPM or Prospectus, each of which could have an adverse effect on the Fund or other investment vehicle and on the value of Interests.
An investment in the Fund or other investment vehicle is suitable only for sophisticated investors and requires the financial ability and willingness to accept the high risks and lack of liquidity associated with an investment in the Fund or other investment vehicle. Investors in the Fund or other investment vehicle must be prepared to bear such risks for an indefinite period of time. There will be restrictions on transferring interests in the Fund or other investment vehicle, and the investment performance of the Fund or other investment vehicle may be volatile. Investors must be prepared to hold their interests in the Fund or other investment vehicle until its dissolution and should have the financial ability and willingness to accept the risk characteristics of the Fund's or other investment vehicle’s investments.
There can be no assurances or guarantees that the Fund's or other investment vehicles investment objectives will be realized that the Fund's or other investment vehicle investment strategy will prove successful or that investors will not lose all or a portion of their investment in the Fund.
Furthermore, investors should not construe the performance of any predecessor funds or other investment vehicle as providing any assurances or predictive value regarding future performance of the Fund.
The views expressed and, except as otherwise indicated, the information provided are as of the report date and are subject to change, update, revision, verification, and amendment, materially or otherwise, without notice, as market or other conditions change. Since these conditions can change frequently, there can be no assurance that the trends described herein will continue or that any forecasts are accurate. In addition, certain of the statements contained in this webpage may be statements of future expectations and other forward-looking statements that are based on the current views and assumptions of Blue Owl and involve known and unknown risks and uncertainties (including those discussed below) that could cause actual results, performance, or events to differ materially from those expressed or implied in such statements. These statements may be forward-looking by reason of context or identified by words such as “may, will, should, expects, plans, intends, anticipates, believes, estimates, predicts, potential or continue” and other similar expressions. Neither Blue Owl, its affiliates, nor any of Blue Owl’s or its affiliates' respective advisers, members, directors, officers, partners, agents, representatives or employees or any other person (collectively the “Blue Owl Entities”) is under any obligation to update or keep current the information contained in this webpage.
This webpage contains information from third party sources which Blue Owl has not verified. No representation or warranty, express or implied, is given by or on behalf of the Blue Owl Entities as to the accuracy, fairness, correctness or completeness of the information or opinions contained in this webpage and no liability whatsoever (in negligence or otherwise) is accepted by the Blue Owl Entities for any loss howsoever arising, directly or indirectly, from any use of this webpage or its contents, or otherwise arising in connection therewith.
All investments are subject to risk, including the loss of the principal amount invested. These risks may include limited operating history, uncertain distributions, inconsistent valuation of the portfolio, changing interest rates, leveraging of assets, reliance on the investment advisor, potential conflicts of interest, payment of substantial fees to the investment advisor and the dealer manager, potential illiquidity, and liquidation at more or less than the original amount invested. Diversification will not guarantee profitability or protection against loss. Performance may be volatile, and the NAV may fluctuate.
This webpage is for informational purposes only and is not an offer or a solicitation to sell or subscribe for any fund or other investment vehicle and does not constitute investment, legal, regulatory, business, tax, financial, accounting, or other advice or a recommendation regarding any securities of Blue Owl, of any fund or investment vehicle managed by Blue Owl, or of any other issuer of securities. Only a definitive offering document (i.e.: Prospectus or Private Placement Memorandum or other offering material) can make such an offer. Neither the Securities and Exchange Commission, the Attorney General of the State of New York nor any state securities commission has approved or disapproved of these securities or determined if the Prospectus, Private Placement Memorandum or other offering material is truthful or complete. Any representation to the contrary is a criminal offense. Securities are offered through Blue Owl Securities LLC, member of FINRA/SIPC, as Dealer Manager.